







Track every campaign, optimize every channel
Track, visualize, and understand your marketing performance at a glance. Positive User’s Analytics module measures every campaign, automation, and interaction across channels. Make smarter, faster decisions through data-driven marketing and real-time reporting.


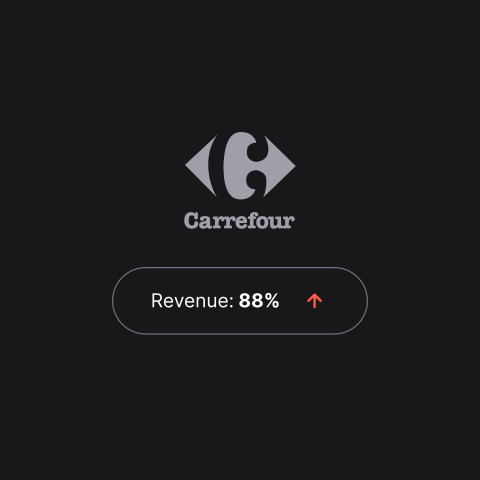
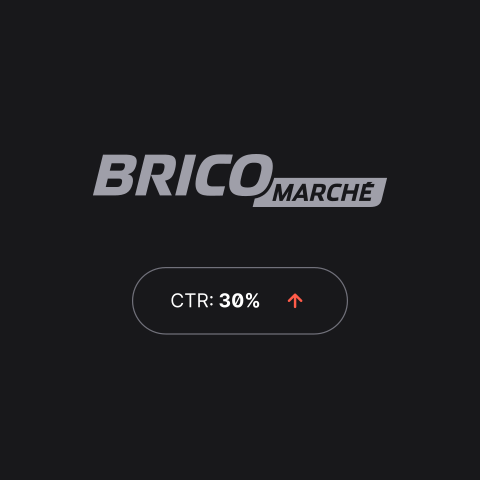
Trusted by +15,000 marketing teams




All your data in one place
No more scattered spreadsheets or complex tools. Centralize your sales, marketing, and support data into a single analytics dashboard. Get a unified view of performance and growth.

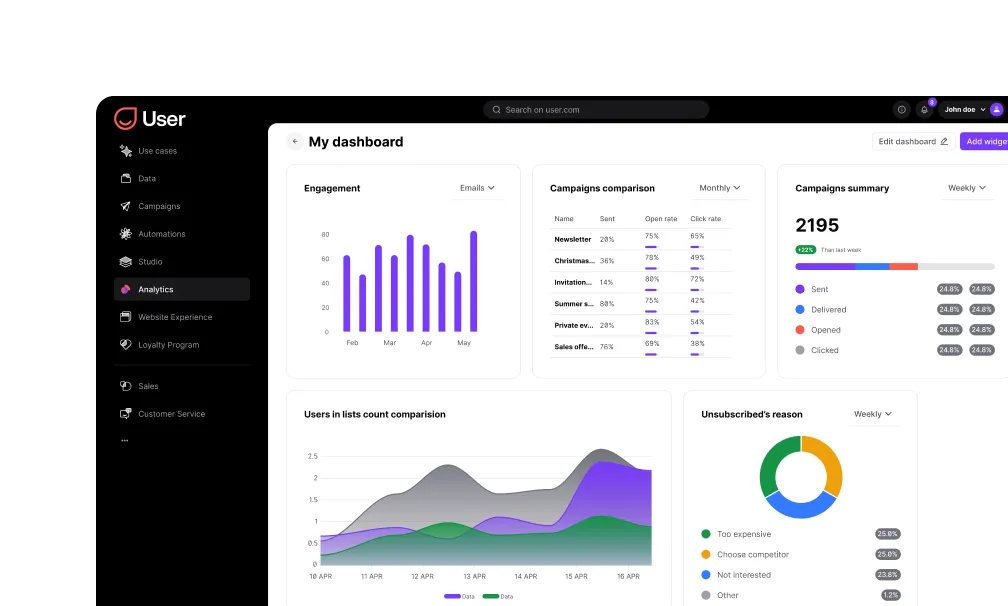
Unified marketing dashboards
Gather data from email campaigns, automation workflows, and customer interactions into a clear, customizable dashboard. Monitor campaign monitoring metrics and email performance side by side.
Real-time tracking
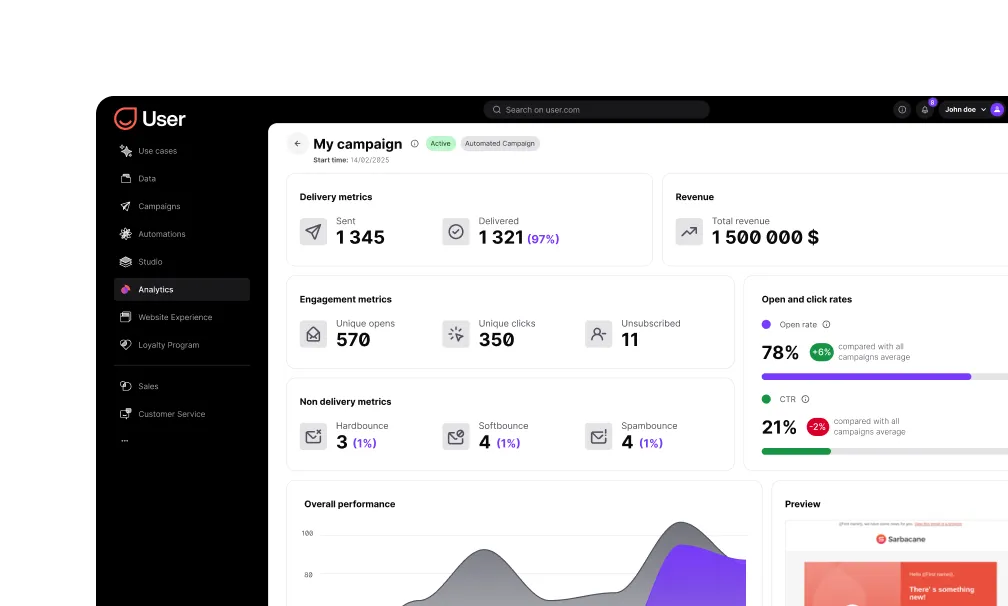
Monitor performance indicators like open rate, click-through rate, conversion rate, and ROI in real time. Stay on top of your business KPIs without waiting for manual reports.
Cross-channel data visualization
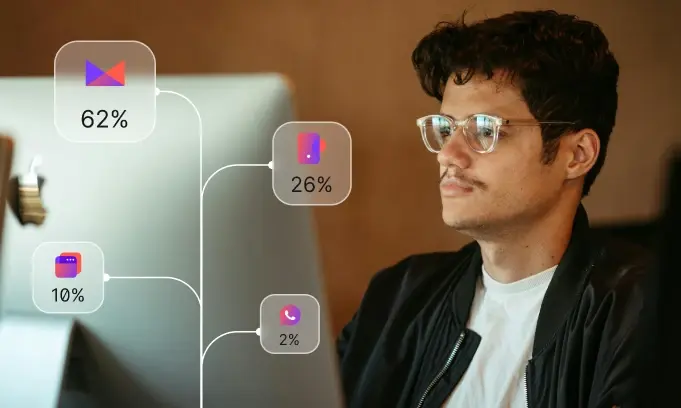
Combine results from every channel: email, SMS, chat, web, and CRM. Analyze your multichannel marketing performance through unified data visualization. Spot trends across channels instantly.
Easy integration
Connect with Google Analytics, CRM systems, or e-commerce platforms. Create a seamless, 360° view of your data. Traffic tracking and visitor behavior flow into your dashboards automatically.
Smart tools for better marketing analysis
Custom dashboards
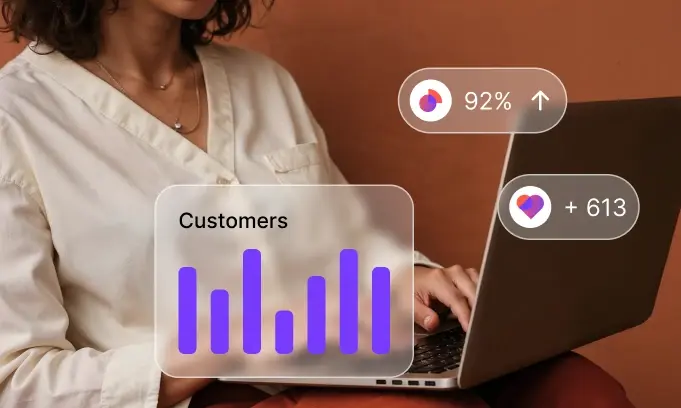
Build your own marketing dashboards and highlight only the KPIs that matter most. Personalize widgets and layouts to visualize your data your way. Track customer statistics at a glance.
Automated reporting
Save time with automated marketing reporting. Schedule recurring reports to your inbox and keep your team informed, no manual exports needed.

Performance tracking & attribution
Measure marketing attribution across campaigns and channels. Identify which touchpoints drive the most conversions and engagement. Performance tracking connects every action to revenue.
Turn analytics into growth
Data correlation & behavioral insights
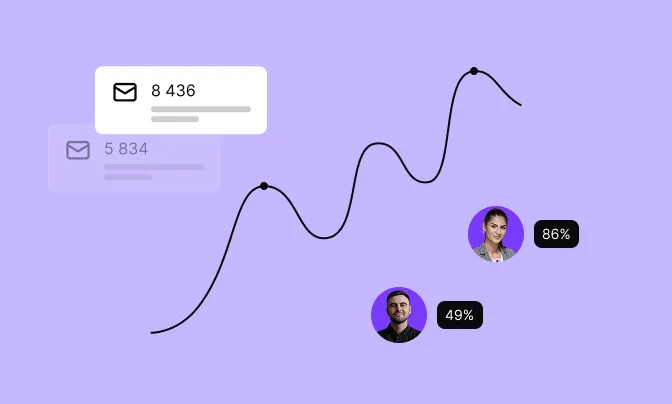
Uncover patterns in your marketing data. Compare campaigns, analyze trends, and identify customer segments based on behavioral analysis. Data analysis turns raw numbers into clear direction.
Marketing performance optimization
Use insights from your dashboards to fine-tune your campaigns, automations, and website experiences. Optimize every step of your marketing funnel. Marketing performance optimization replaces guesswork with evidence.

Shared reports & team alignment
Export your analytics in multiple formats or share dashboards across your organization. Keep marketing, sales, and support teams aligned with a single source of truth. Better collaboration means faster decisions.
From insights to action
Campaign comparison & segment analysis
Run side-by-side comparisons across channels (email, SMS, and web) to evaluate what drives engagement. Break down results by segment analysis to understand which audiences convert and why.
Funnel monitoring & conversion measurement
Visualize your entire marketing funnel from first touch to revenue. Identify drop-off points and measure conversion rates at every stage. Focus your marketing performance management efforts where they matter most.
Trusted by fast-growing teams
You may be interested by these features
Automation
Turn repetitive tasks into efficient workflows

Campaigns
Reach your audience everywhere with multichannel campaigns

Studio
Personalize your messages on every channel
Data
Make informed decisions based on reliable data

Contacts
Manage & segment your audience in one place
Website Experience
Turn every visit into engagement with personalized journeys

Loyalty
Build lasting relationships with your customers
Sales
Turn strangers into loyal customers

Customer Service
Deliver fast, reliable and human-first support

Uma
Turn ideas into ready-to-run workflows with AI
Try a smarter way to measure your marketing performance
Join the 100,000 professionals who trust Positive User to track every action and optimize every channel with real-time marketing analytics.

Frequently Asked Questions
What can I track with Positive User Analytics?
Monitor all your marketing KPIs: from campaign performance and conversion rates to customer engagement and automation results. KPI tracking covers every channel.
Can I customize my analytics dashboard?
Yes. Create personalized dashboards to visualize only the metrics that matter. Filter by channel, segment, or time period without unnecessary data clutter.
Does Positive User provide real-time reporting?
Yes. Access real-time reports on campaign performance, visitor behavior, and funnel metrics. Data updates continuously. No manual refresh needed.
How does Positive User help measure ROI?
With built-in ROI measurement and attribution tracking. Identify which marketing actions drive the highest returns and allocate budget with confidence.
Can I compare campaigns across channels?
Yes. Run multichannel analysis to evaluate how each campaign performs across email, SMS, and web interactions. Campaign comparison highlights what works best.
Is it possible to automate reporting?
Yes. Use automated reporting to schedule periodic email reports or generate instant summaries. Keep stakeholders informed without manual work.
Can I integrate external tools like Google Analytics?
Yes. Positive User integrates seamlessly with Google Analytics and other third-party tools for comprehensive data analysis. Your data flows into one unified view.
Does Analytics track customer behavior?
Yes. The module includes behavioral analysis features. Understand how customers engage across channels, identify patterns, and act on customer statistics in real time.
How does Analytics support team performance?
Track activity metrics for marketing, sales, and support teams; all within one business performance dashboard. Business KPIs stay visible for every stakeholder.
Can I export or share analytics reports?
Yes. Export data in multiple formats or share dashboards across your organization. Aligned reporting drives better collaboration and faster decisions.